Data Visualization
Treatment Change Effects
How different treatments may be affecting your tics.
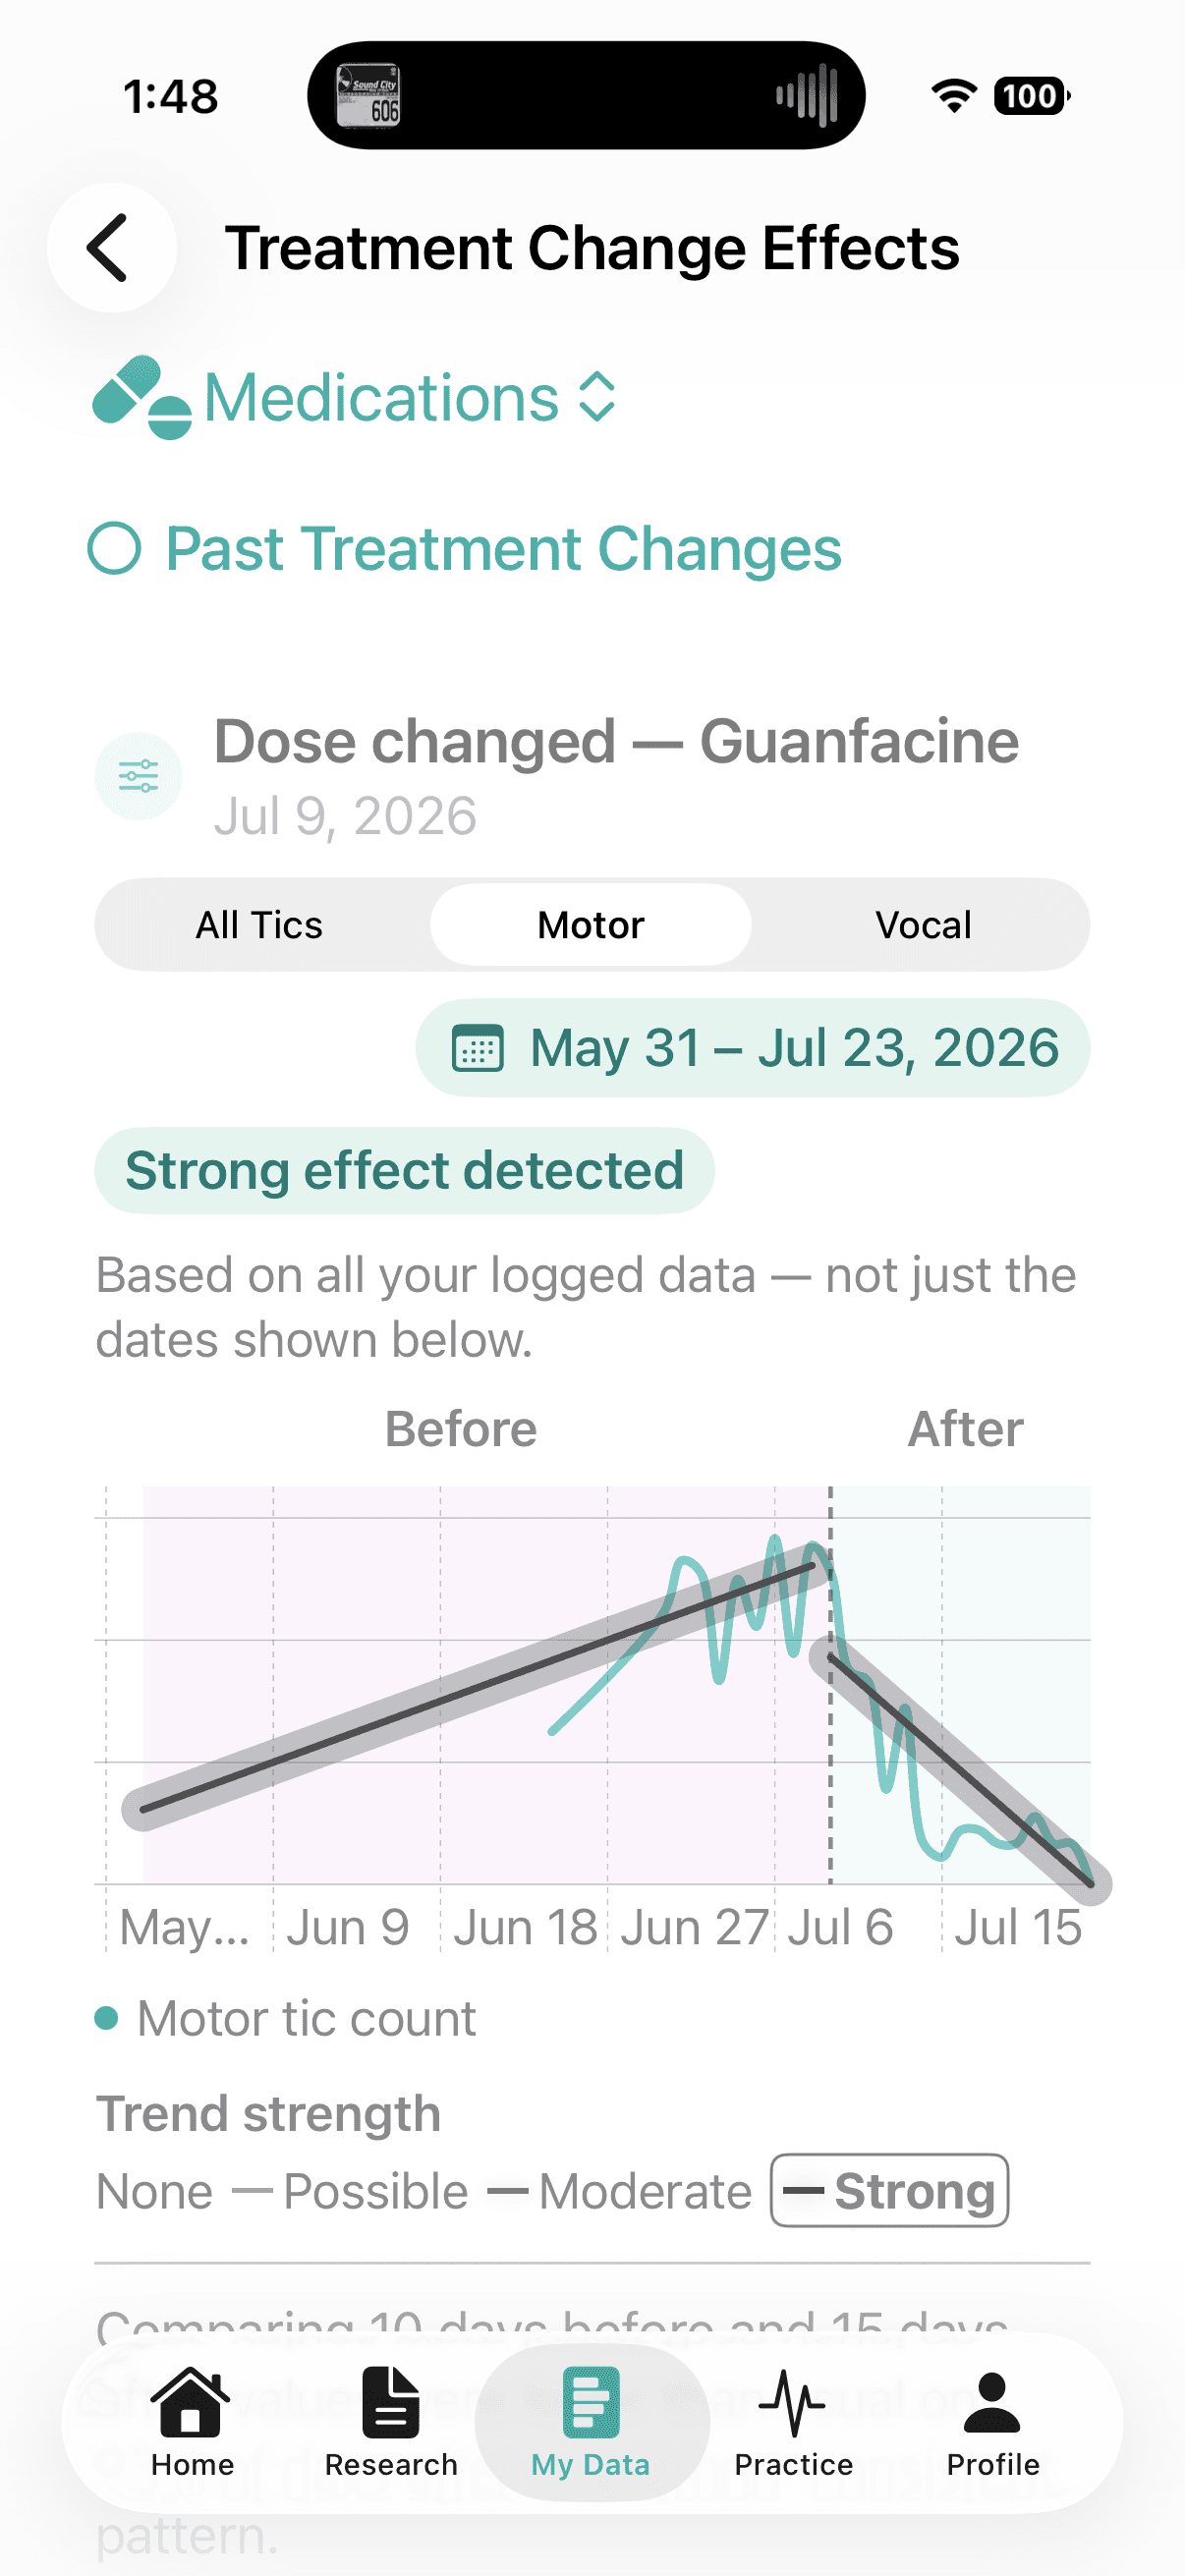
Treatment Change Effects shows how starting, stopping, or adjusting a treatment may be affecting your tics — which can help immensely when planning with a healthcare provider and managing your own treatment day to day.
Medications & behavioral therapies
Filter, compare, and zoom in
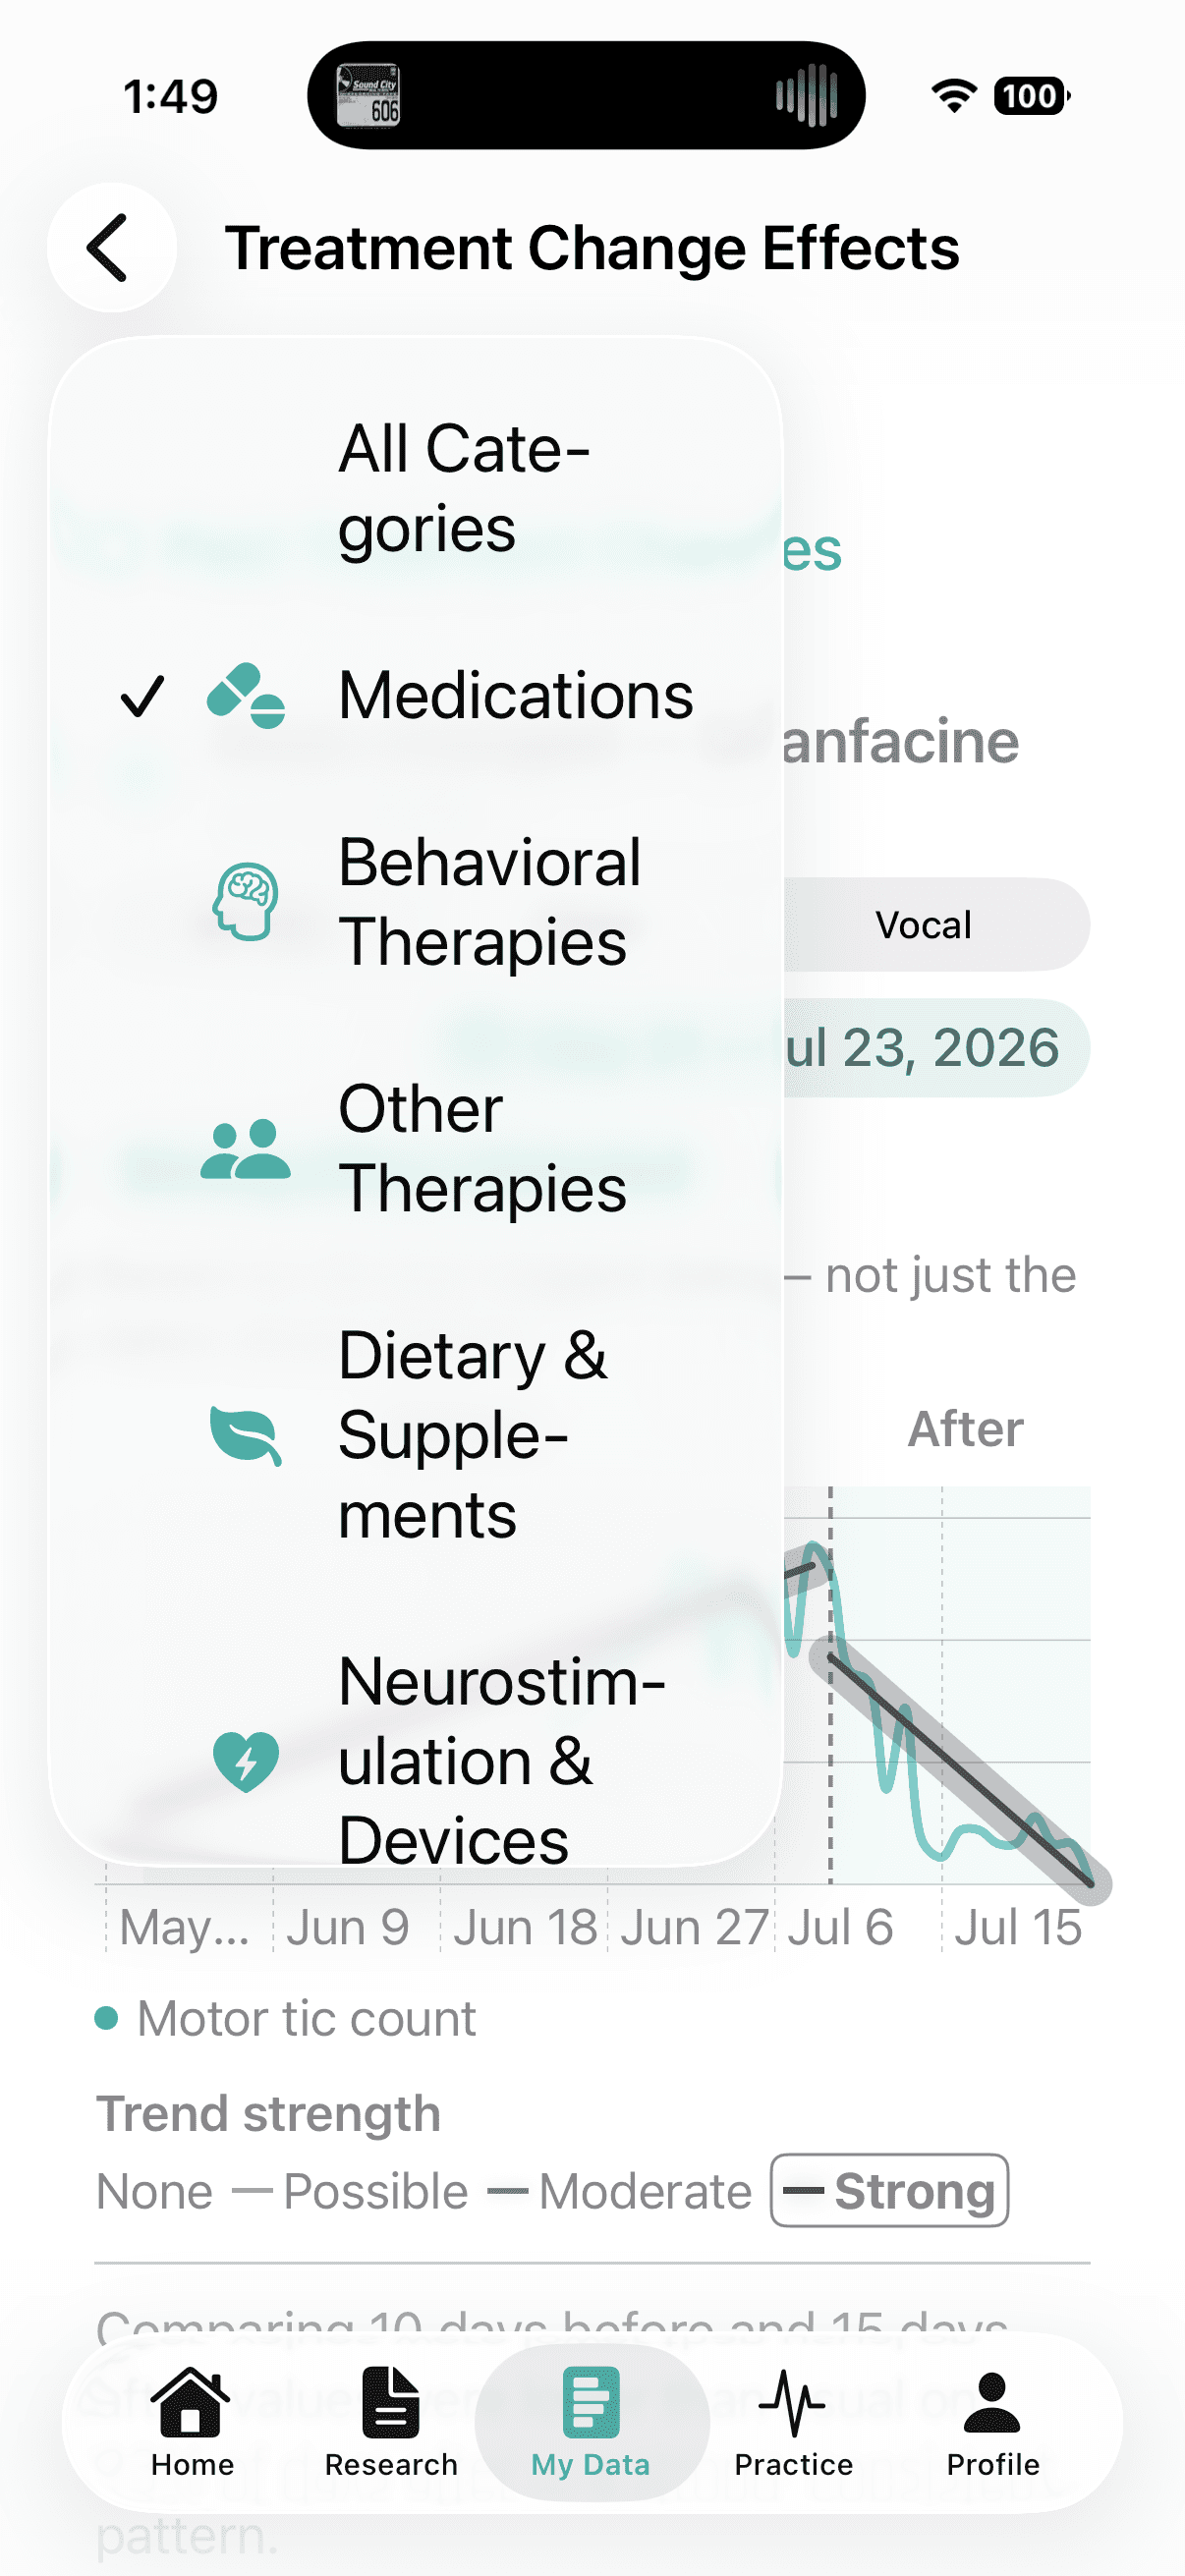
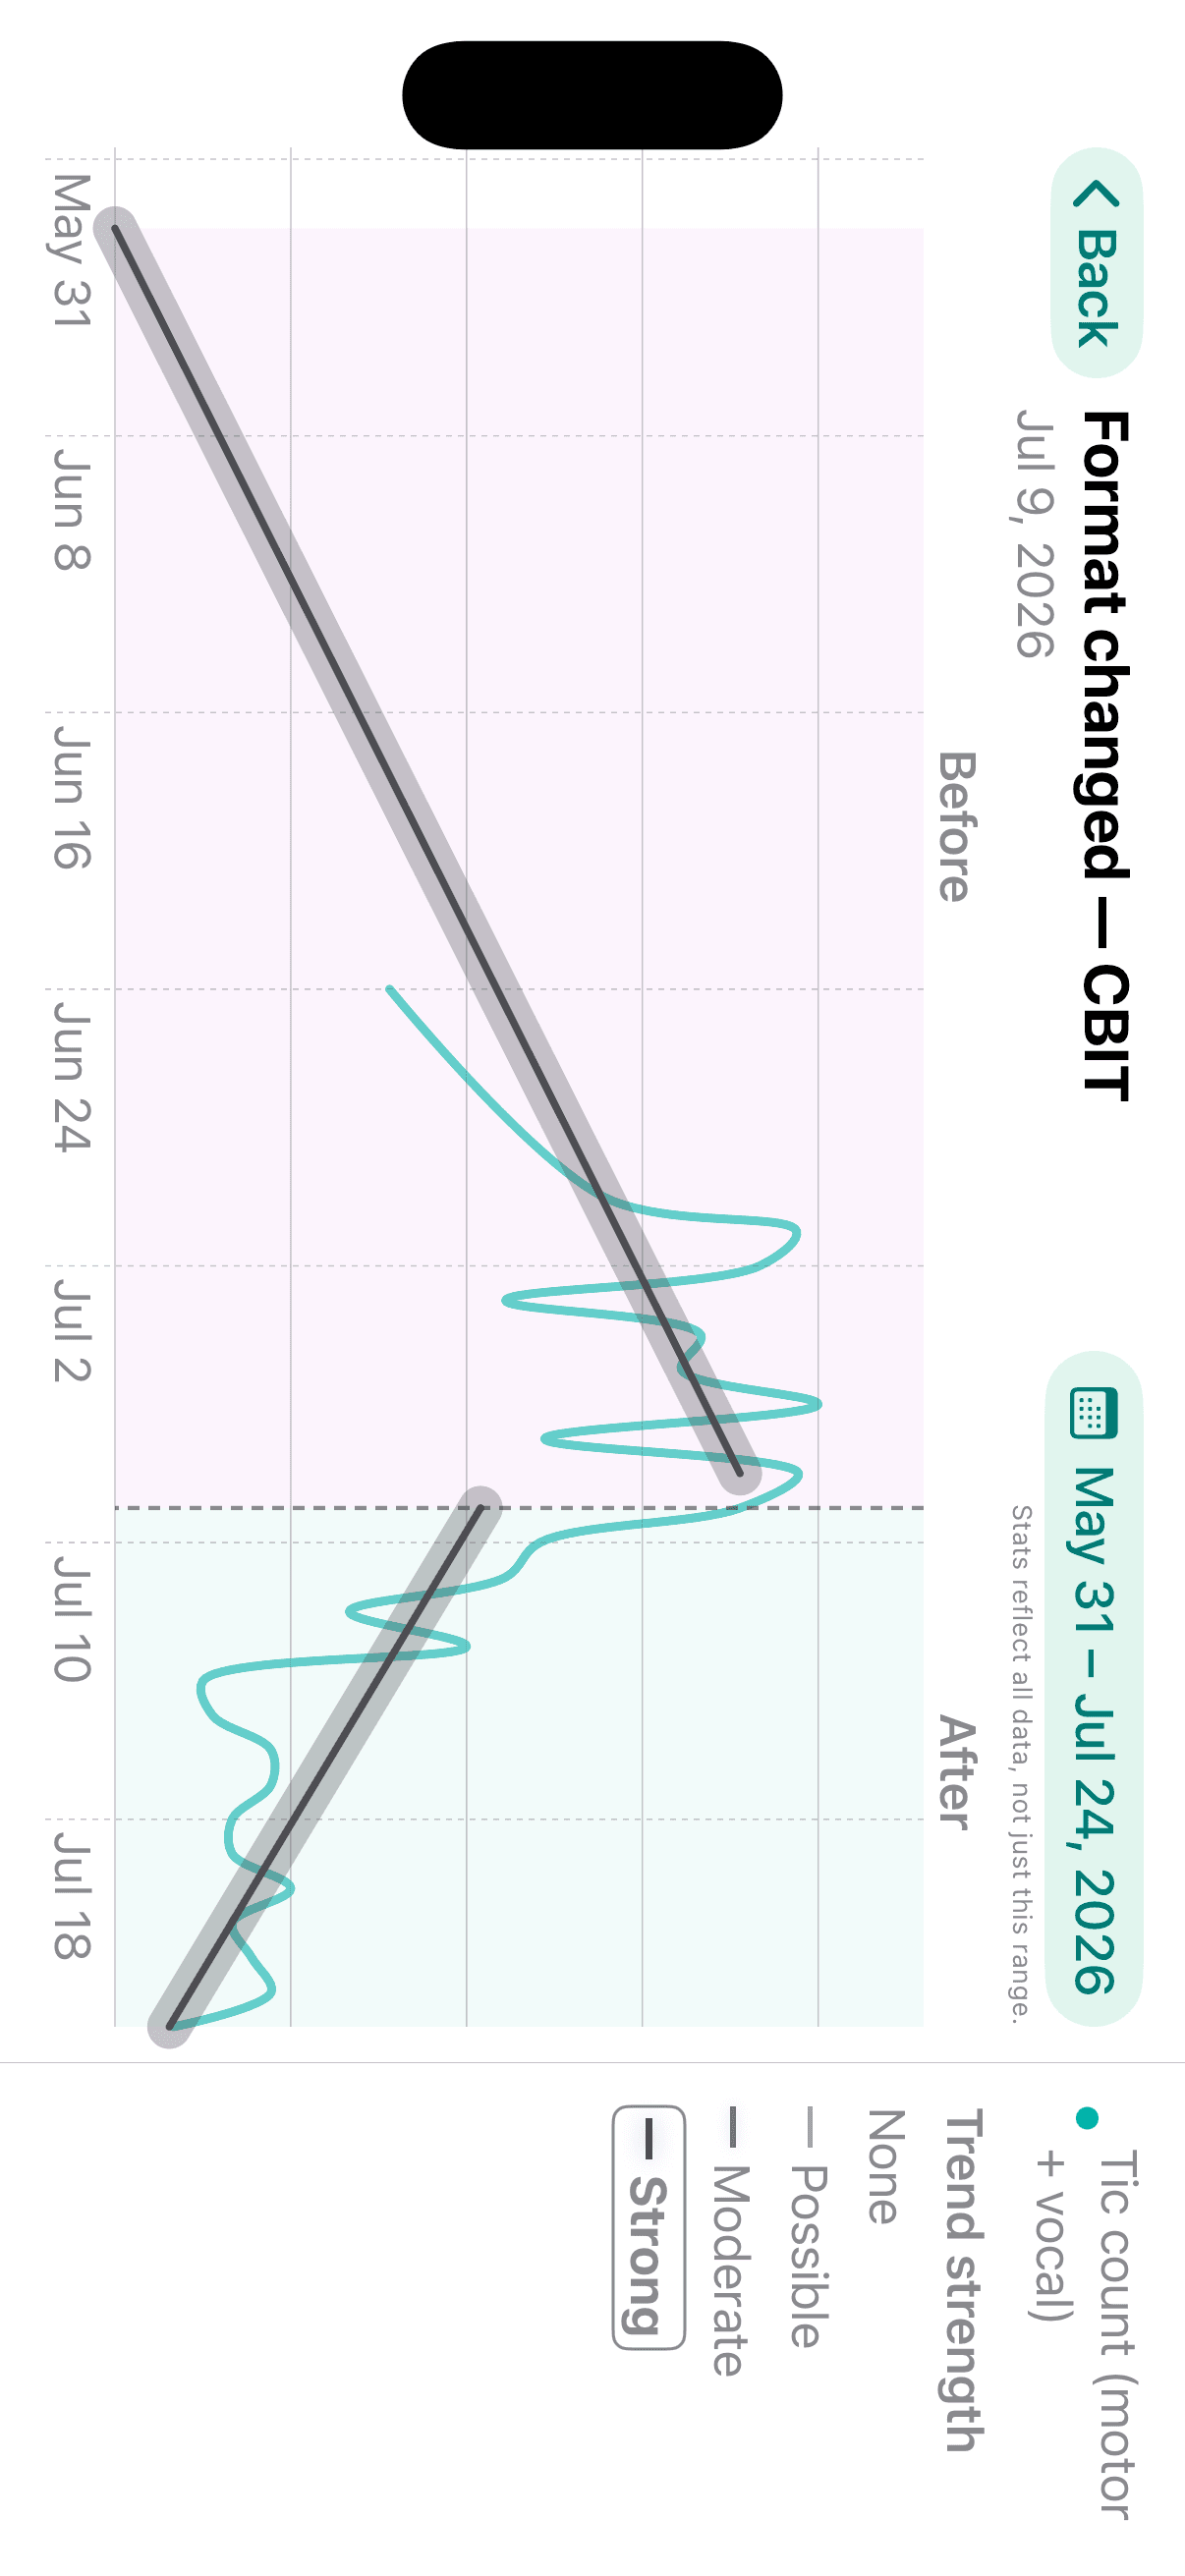
Filter to a specific category — Medications, Behavioral Therapies, Other Therapies, Dietary & Supplements, or Neurostimulation & Devices — then choose any past change in treatment to see how tic counts changed before and after. Rotate to full screen for a larger, easier-to-read version of the same chart.